Task Monitor and Service Status
The task monitor allows you to look into the status of analytics being run for your KPIs. If some analytics haven't been completed even after a long time or if some dashboards are missing, you can use the task monitor to identify such issues.
The service status can be used to quickly determine if all of the Chaos Genius services are up and running.
Both of these can be accessed on the status page at http://localhost:8080/api/status, for local deployments. Replace localhost with the IP address or hostname of the server for cloud deployments.
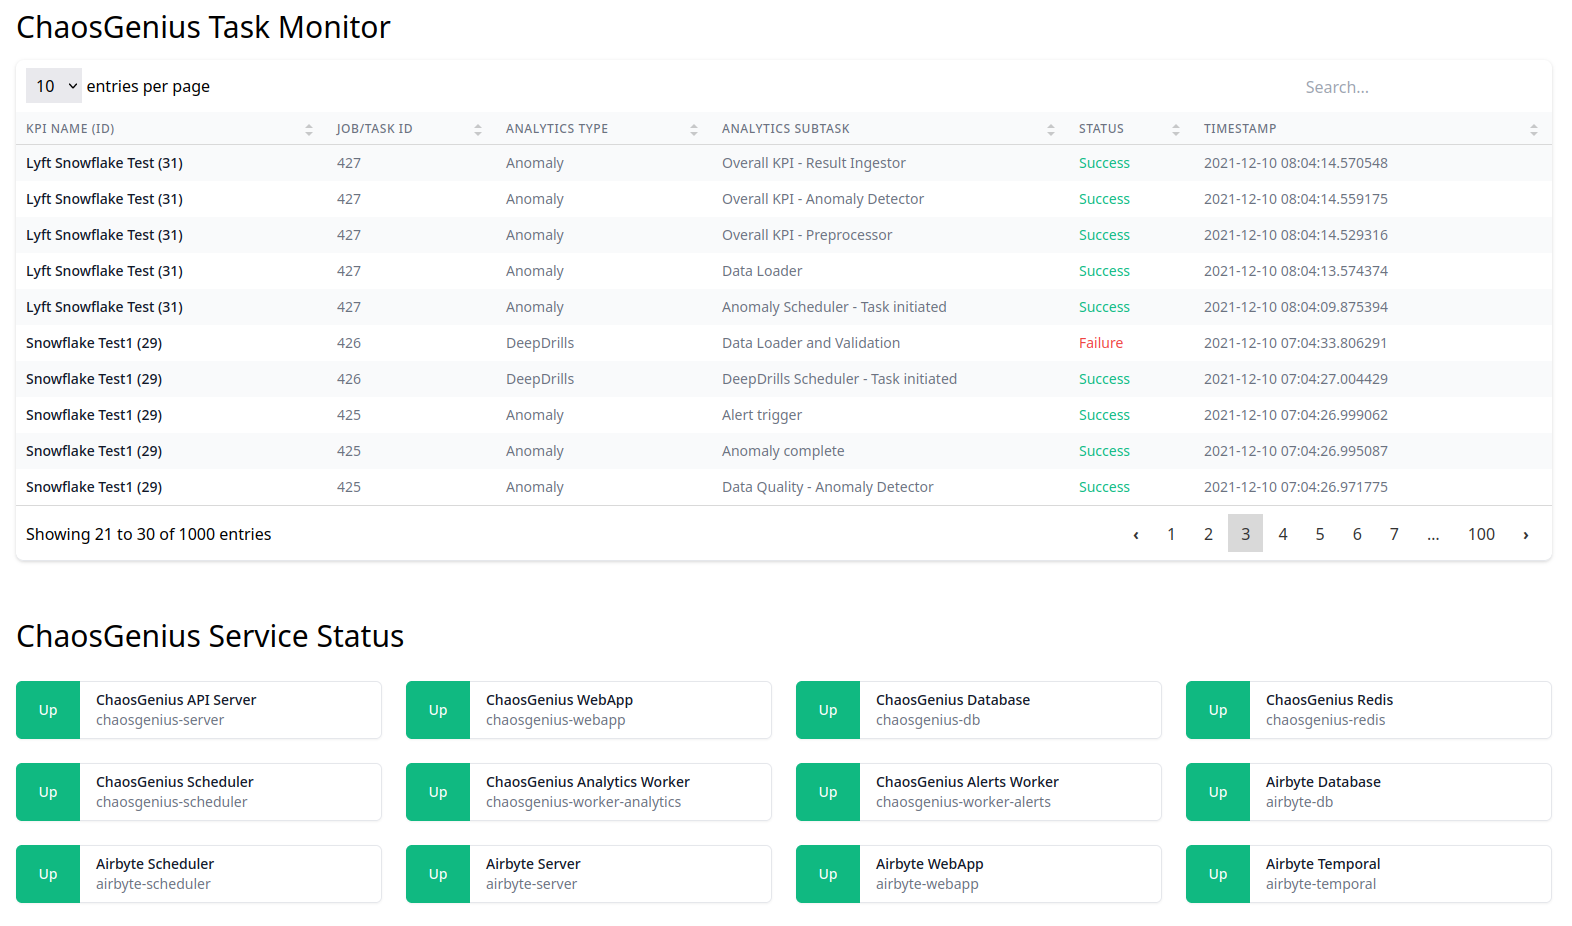
The task monitor shows the following details:
- KPI name, KPI ID and Task ID
- Task ID is unique to the task (Anomaly or KPI Summary) being run.
- Analytics Type
- KPI Summary or Anomaly.
- Analytics Subtask
- These are specific checkpoints in the computation. For example, a failure at "Data Loader" would indicate that ingesting data from the DB/DW failed.
- Status
- "Success" or "Failure".
- Timestamp
- Server time at which error occurred.
To debug failures, search for (Task: <Task ID here>, KPI: <KPI ID here>) in the logs. For example, to get logs for the failed task in the above screenshot, search for (Task: 428, KPI: 29). On a docker deployment, this can be done using:
docker logs chaosgenius-worker-analytics 2>&1 | grep "(Task: 428, KPI: 29)"
Note: In an upcoming release, we will display the relevant errors along with the failed subtask in the task monitor.
The service status displays the status, up or down, of each Chaos Genius service. Below the name of the service is the corresponding container name.
Note: Currently, the service status is only available for docker deployments, it will not be displayed on a non-docker compose deployment.