DeepDrills
DeepDrills consists of both single and multi-dimensional analyses of your data along with waterfalls to identify the top drivers of change in your KPIs.
Enabling DeepDrills
Currently DeepDrills is disabled by default, to enable it just update the DEEPDRILLS_ENABLED variable in the env to True. For more information please refer to the Config Param Guide.
Updated KPI Summary Page
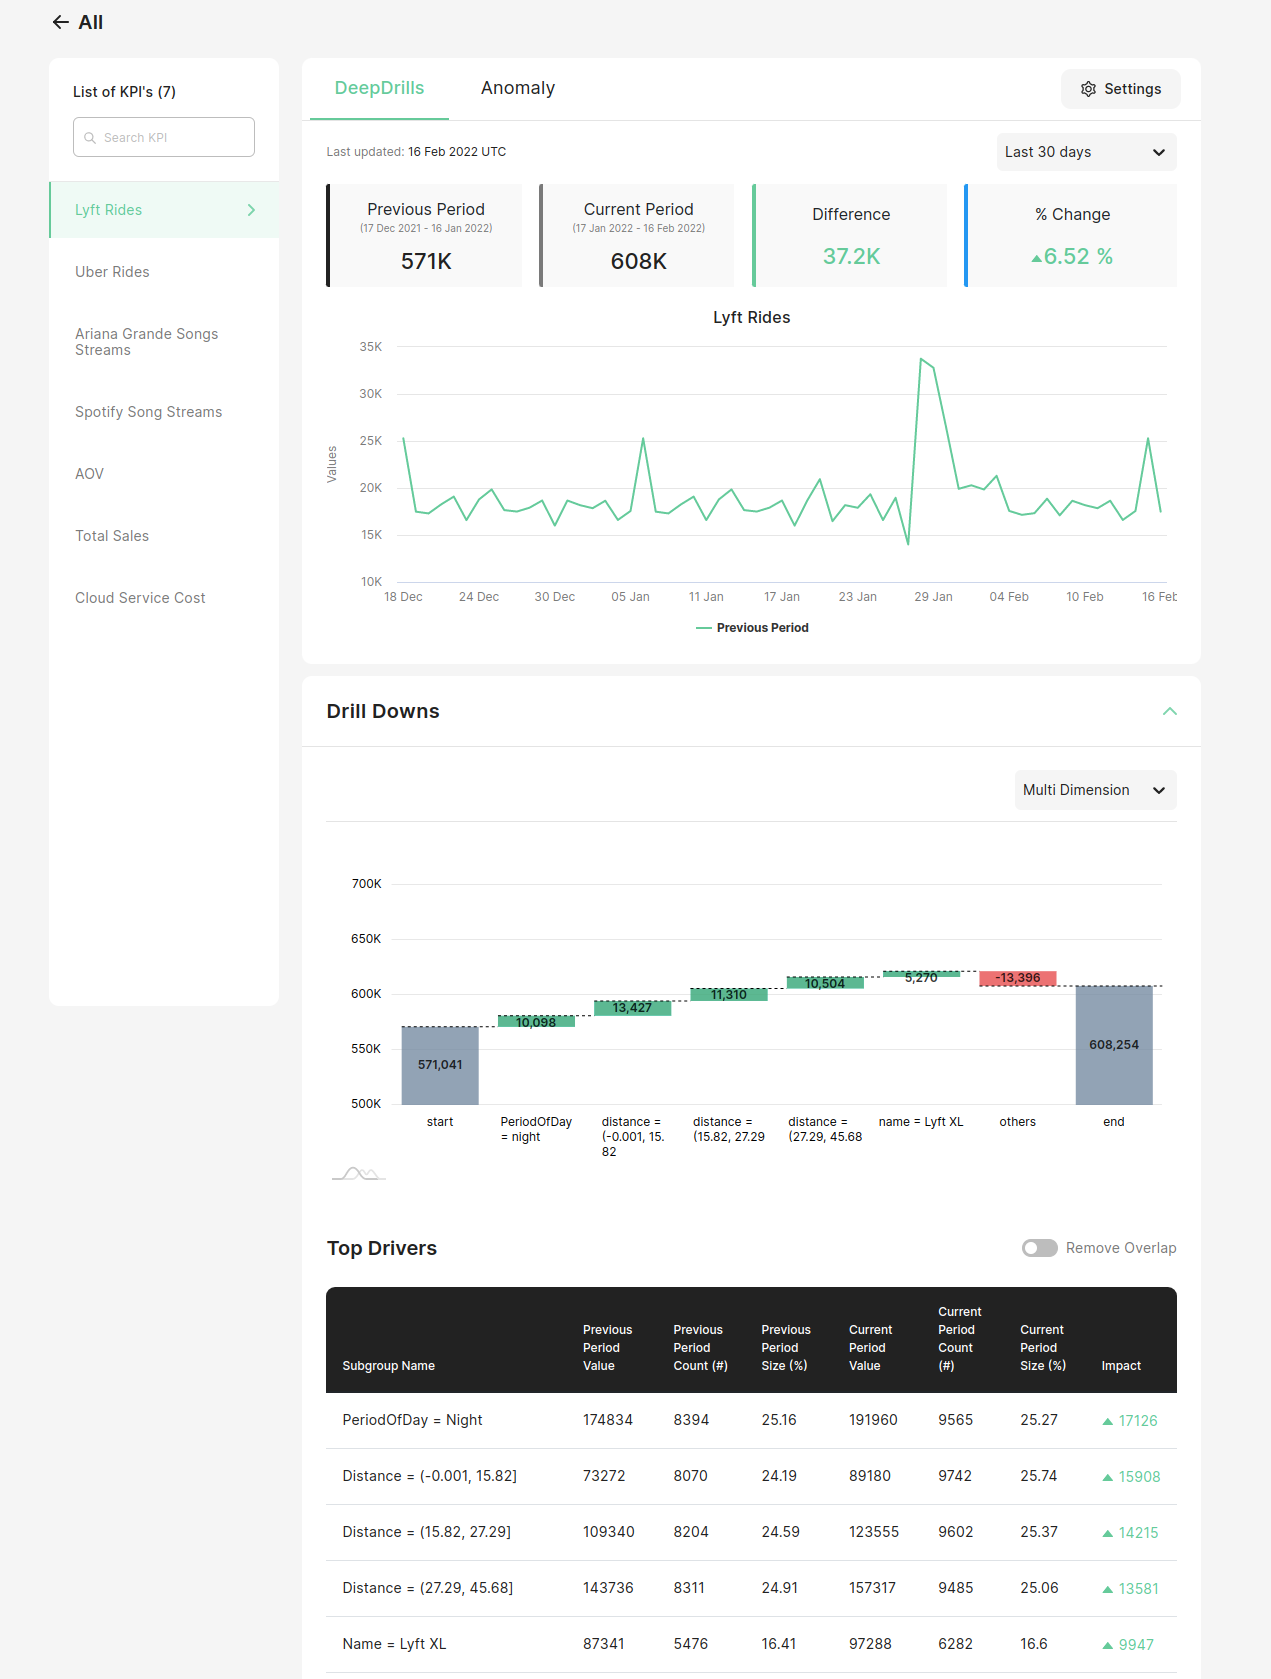
The KPI summary page will now also have a DeepDrills subsection with drilldowns and waterfall charts for your KPIs.
Single Dimensional Waterfall
Just under the Summary Panel and Time Series, you can view the waterfall plot. The waterfall plot shows the most impactful subgroups and their impacts on the KPI metric.
You can use the dropdown to select the Single Dimensional analysis. Then use the tabs to select a sub-dimension.
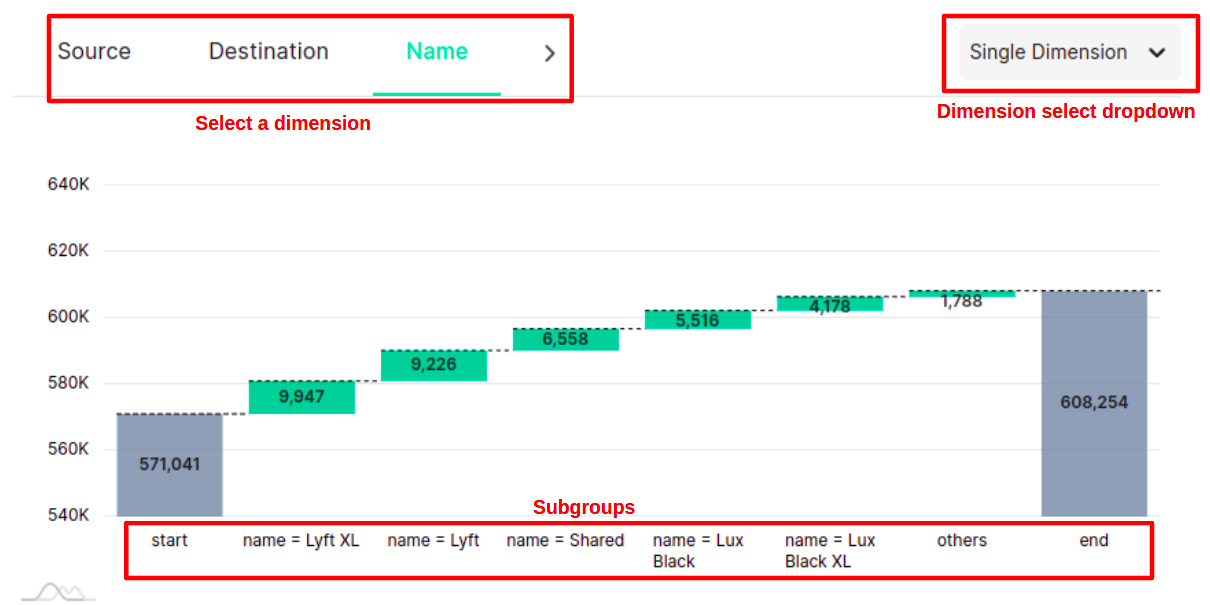
Notice that all subgroups are values of the selected sub-dimension. For the selected single dimension, you can see how specific values of a sub-dimension affect the KPI.
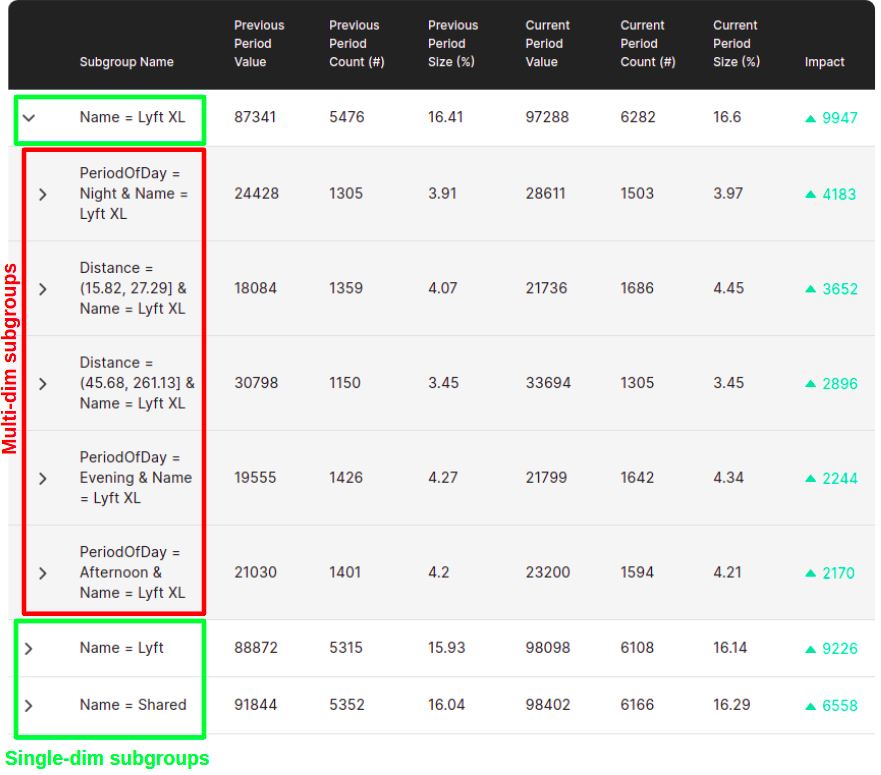
Below the waterfall charts, you can view the impact of each value of the selected sub-dimension. For example, we can see the overall impact of Name = Lyft XL. By clicking the expansion arrow next to a single dimensional subgroup, you can perform Drill-Downs and also view a breakdown of all the multidimensional subgroups that compose this subgroup.
By default subgroups are sorted by their absolute impact.
Multi-Dimensional Waterfall
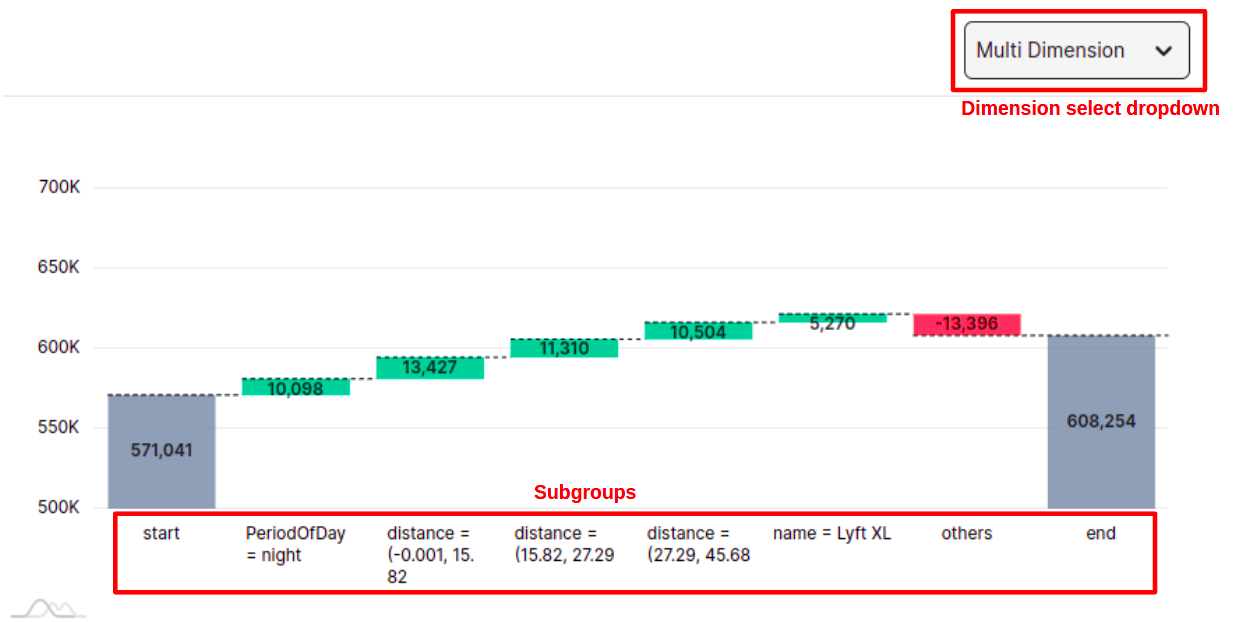
You can use the dropdown to select the Multi-Dimensional analysis. The Multi-Dimensional waterfall has the advantage over single dimensional waterfall due to the fact that it compares all subgroups to find the most impactful ones instead of being limited by a single dimension. The downside is that it is computationally more expensive due to overlap calculations.
Each tile in the waterfall represents a subgroup (a combination of 1 or more sub-dimension values that exists in the dataset). The start and end tiles are for the KPI value in the selected time range groups, respectively. In this example, start is the Lyft Rides Rides for Previous Period (17th Dec 2021 - 16th Jan 2022), while end is the Uber Rides for current period (17th Jan 2022 - 16th Feb 2022).
The "others" tile represents the sum of impacts from all other not-shown subgroups which each individually, had a minimal impact.
Below the waterfall charts, a table of the "Top Drivers" subgroups is displayed along with calculations for aggregations comparing the previous to current month. By default, subgroups are sorted by their absolute impact.
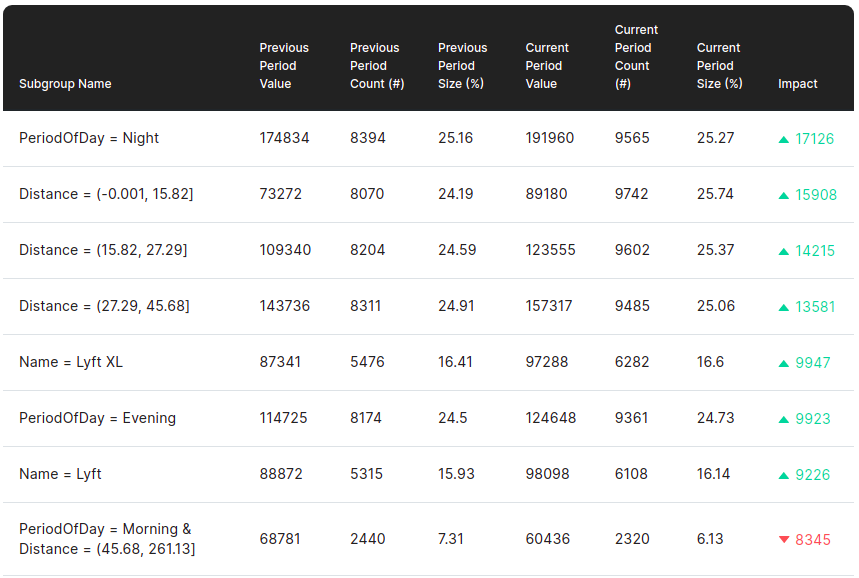
Subgroups could overlap when they have a value for a dimension in common. For example, PeriodOfDay = Morning would overlap with PeriodOfDay = Morning & Distance = (45.68, 261.13] as any datum in the latter subgroup would also be included in the former subgroup.
With Chaos Genius, you can look at the calculated non-overlap impact by toggling the "Remove Overlap" switch.