Adding KPIs
What is a KPI
A Key Performance Indicator (KPI) is a statistic that is used to quantify progress towards critical business objectives. Some examples of KPIs include:
Monthly Sales
Average Order Value
Daily Active Users
Alone, these KPIs will provide a baseline representation of how your business is doing.
However, by adding these KPIs to Chaos Genius, you will be able to use our KPI Summary and Anomaly Detection features to instantly gain insights that would have taken hours to gather manually.
Add a KPI
KPIs can be added on the "KPI Explorer" page. Start by clicking "New KPI".
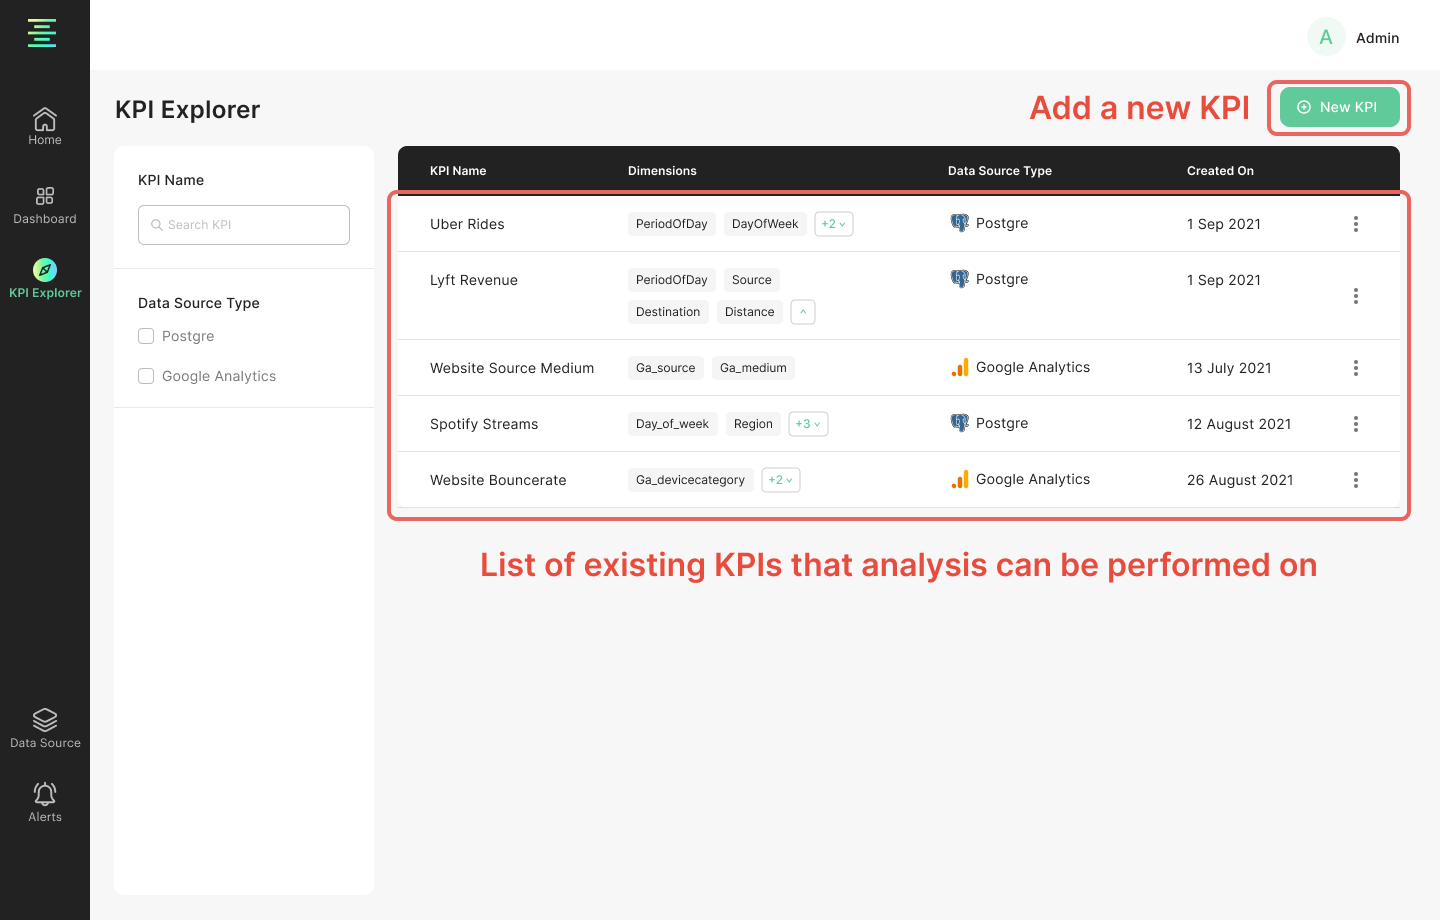
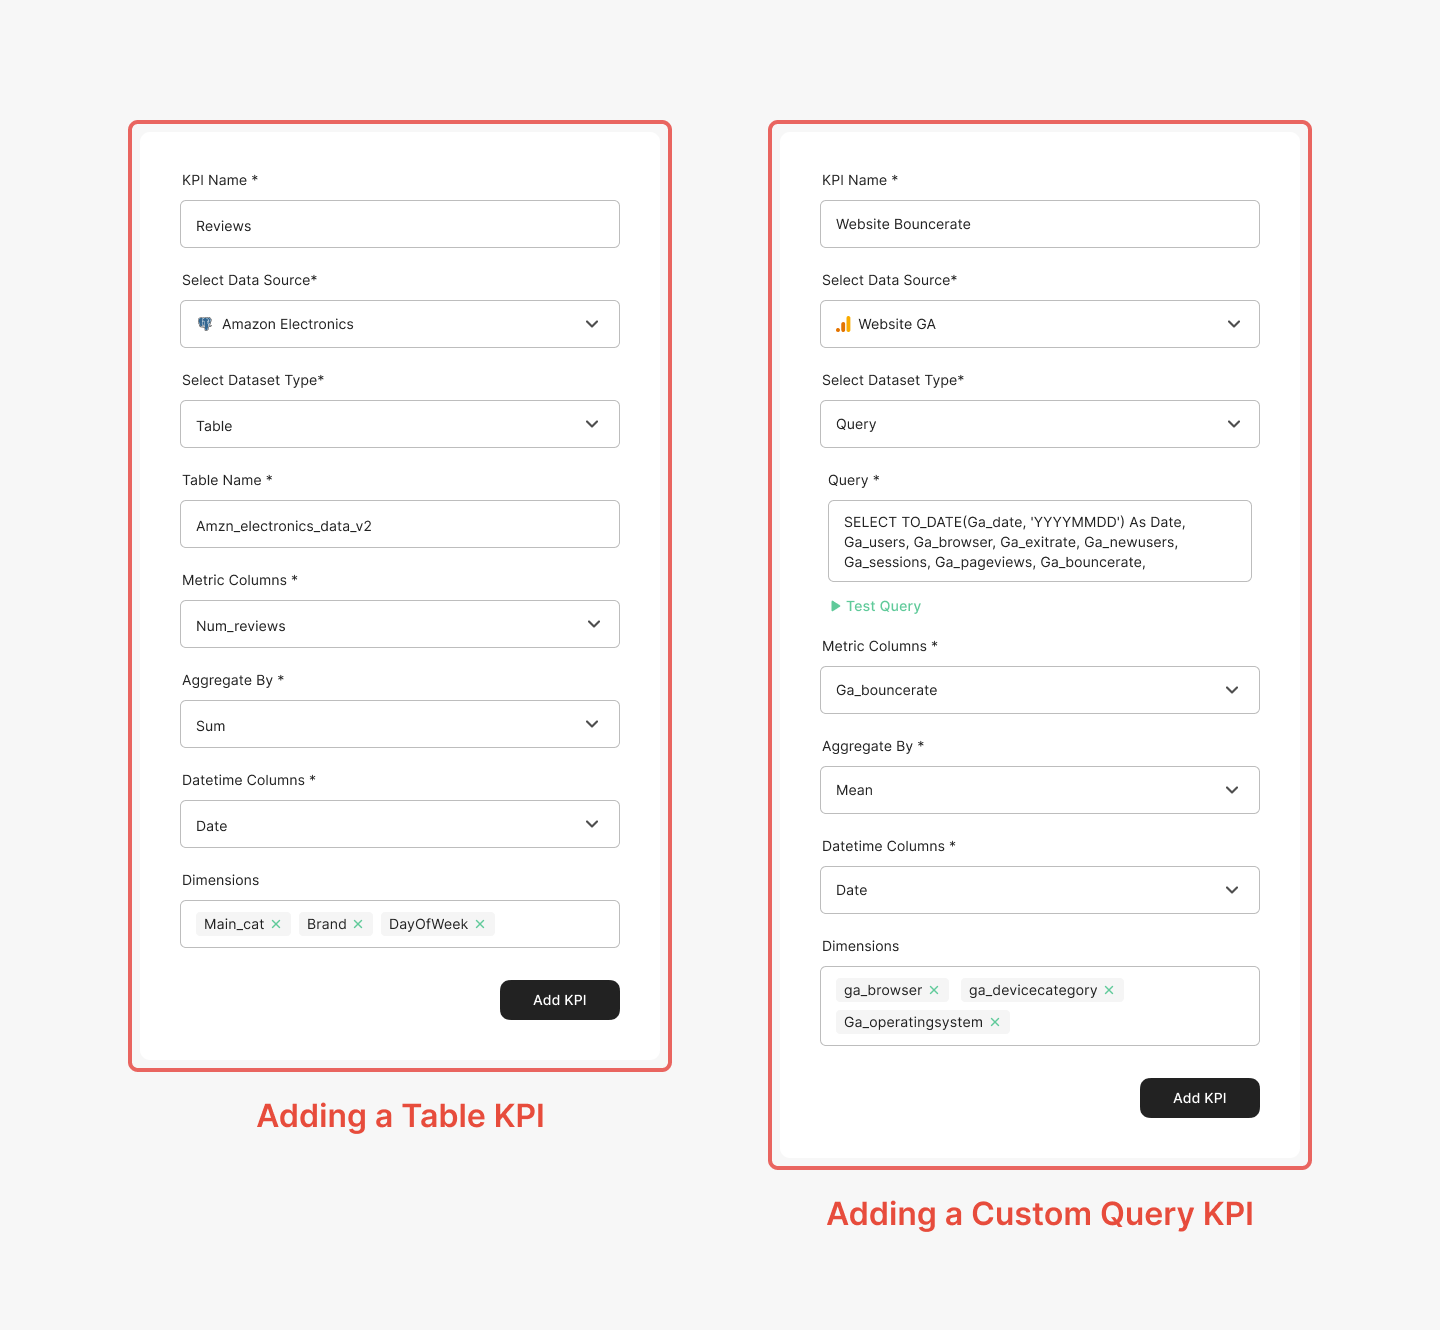
Table vs Custom Query KPIs
Table KPIs
These KPIs are simpler to set up and can be defined by directly performing aggregation on an existing table in your data source.
However, if you wish to do any kind of preprocessing, or collect data from multiple tables, you will need to use a Custom Query to define your KPIs.
Custom Query KPIs
These KPIs are constructed using your own query. As opposed to Table KPIs, here you can utilize an added functionality by using multiple tables, performing single and multi-table transformations and more when defining your KPI.
Before proceeding to define your KPI, ensure you click "Test Query". If no errors are present, the added query is valid. The validity of a query depends on the data source. For example, if the data source is Postgres or MySQL, the query needs to adhere to the database's syntax.
KPI Parameters
KPI Name
Please select a unique recognizable name for your KPI. Shorter names will help you navigate better.
Data Source
Select the Data Source which contains the underlying data for your KPI. Currently you can only select one Data Source for a KPI.
DataSet Type
As detailed above, you can select a Table or Query based KPI depending on your requirements.
Schema
If you select your Data Set Type as 'Table', then an additional option to choose the schema in which your table belongs is to be selected.
Metric Column
The column chosen for Metric Column is what will be used for aggregation in order to define your KPI.
Count Column (Currently applicaple for Druid only)
The column representing the count values of the rolled-up data, this column can also be proxy for count for the rolled up data i.e. not representing the actual count and can be an estimated value.
Aggregate By
Aggregate By has three options:
Mean
Count
Sum
If you need more options for aggregation, then create an issue, or if you wish to contribute more aggregation methods, raise a PR.
Datetime Column
From all the columns displayed for Datetime Columns, you need to choose the one that stores time. If you're facing any issues regarding your datetime column visit our Datetime Formats Guide
Dimension Columns
These columns are the ones you want Chaos Genius to do analysis on. You can choose a maximum of 10 columns. If you come across any problems while adding dimensions refer to our Dimensions Guide
KPI Validation
Once all the details for a new KPI are filled in and you click "Add KPI", Chaos Genius will run validations and check whether it is valid KPI definition. In case of an invalid KPI definition, you will be shown an error message. Please see the Troubleshooting section for more information.
Import KPIs (Coming Soon)
You will be soon able to import KPIs from your favorite BI tools like Metabase, Superset or directly from dbt.
Next Steps: Analytics
Once the KPI is added, your one-time analysis for DrillDowns will be initiated. For the first analysis, it take upto 15-30mins depending upon the volume of data being processed. Subsequently, you will be able log onto your dashboard daily and find fresh insights based on the updated data received from the connected Data Source.
For Anomaly Detection, you will be required to configure the Anomaly Detector settings to initiate the analysis.