Anomaly Detection
In order to run Anomaly Detection on the selected KPI, you need to configure in Anomaly Detector settings either during the Activate Analytics step during the Chaos Genius setup or by navigating via the Dashboard to the selected KPI and selecting Anomaly analysis tab.
Anomaly Detector Settings
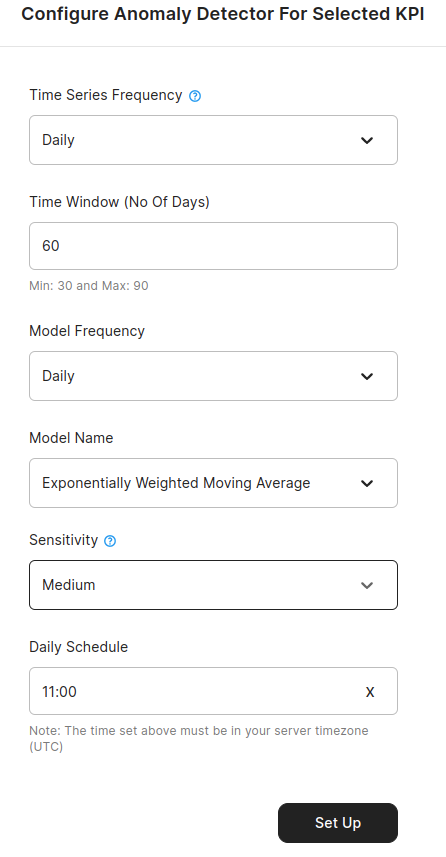
There are multiple parameters that you can tune to configure the Anomaly Detection analytics for selected KPI.
Time Series Frequency
This input is for the model to understand the frequency of the incoming data. If you have data points coming in once a day, set it to daily or if you have data points coming once a hour, then set it to hourly.
Time Window
Time Window is the historical data points which will be used to train the selected model on your data to learn about the trends, seasonality and patterns for the selected KPI. If you choose a time window of 90 days with daily frequency data, past 90 days of data will be examined. For daily data, time window needs to be in the range of 30 to 60 days. For hourly data, time windows is between 7 to 21 days. Disclaimer: If the window size is greater than the data availbable, anomaly detection won't run. We are currently working on resolving this issue.
Model Frequency
This is the frequency at which Chaos Genius will run Anomaly Detection. Chaos Genius provides the option for either Daily or Hourly frequency. If you choose Daily, this means, Chaos Genius will run Anomaly Detection once a day at a specified time. If you choose Hourly, Anomaly Detection will run every hour at the specified minute.
Model Name
Here you will select which model will be used to run anomaly detection. You can find a list of available models and their use cases is the Anomaly Detection Algorithms section below.
Sensitivity
Sensitivity is a measure of the model's response to anomalous data points. A higher sensitivity will lead to even small changes being detected as anomalies and whereas lower sensitivity will only generate anomalies on larger changes.
Schedule
The time at which to run anomaly detection. If you select Model Frequency as Daily, Schedule Time is the hour of the day at which Anomaly will run. If you select Hourly, Schedule Time is the minute of the hour at which Anomaly will run. Note the time set here is in accordance to your server time on which Chaos Genius is set up.
Anomaly Detection Algorithms
Chaos Genius offers multiple algorithms that can be selected for different KPIs based on the use-case and expected noise in the data in order to minimize false positives and alert fatigue.
Prophet
Prophet is an open source software released by Facebook. It is a time series forecasting technique based on an additive model that fits non-linear trends with yearly, weekly, and daily seasonality, as well as holiday effects. It's robust to missing data and trend changes, and it usually handles outliers well. Additional details regarding the model are available here.
Exponentially Weighted Standard Deviation (EWSTD)
The EWSTD model is a simple extension to the SD model (which assigns equal weight to every point in time), by assigning more weight to the most recent observations using an exponential scheme. Upper and lower bounds for EWSTD are calculated as a percentage of the moving standard deviation. It handles trends & recent variation in data better as compared to the Standard Deviation Model.
Standard Deviation (SD)
The Standard Deviation model forecasts time series prediction as the standard deviation of the past values. The model should be utilized when your data does not have any significant seasonality. It is also recommended to use the algorithm when you have a large number of metrics to keep track of and you want to save on compute power.
Exponentially Weighted Moving Average (EWMA)
The EWMA model applies weights to the values of a time series. More weight is applied to more recent data points, making them more relevant for future forecasts. Bounds for EWMA are calculated as a percentage of the moving average. Similar to EWSTD, It is faster at adapting to trends and recent variations but cannot capture seasonality in the data.
Analysing Anomaly Detection
On the Dashboard, make sure to select the "Anomaly" tab. Then select the desired KPI from the list of configured KPIs on the left sidebar.
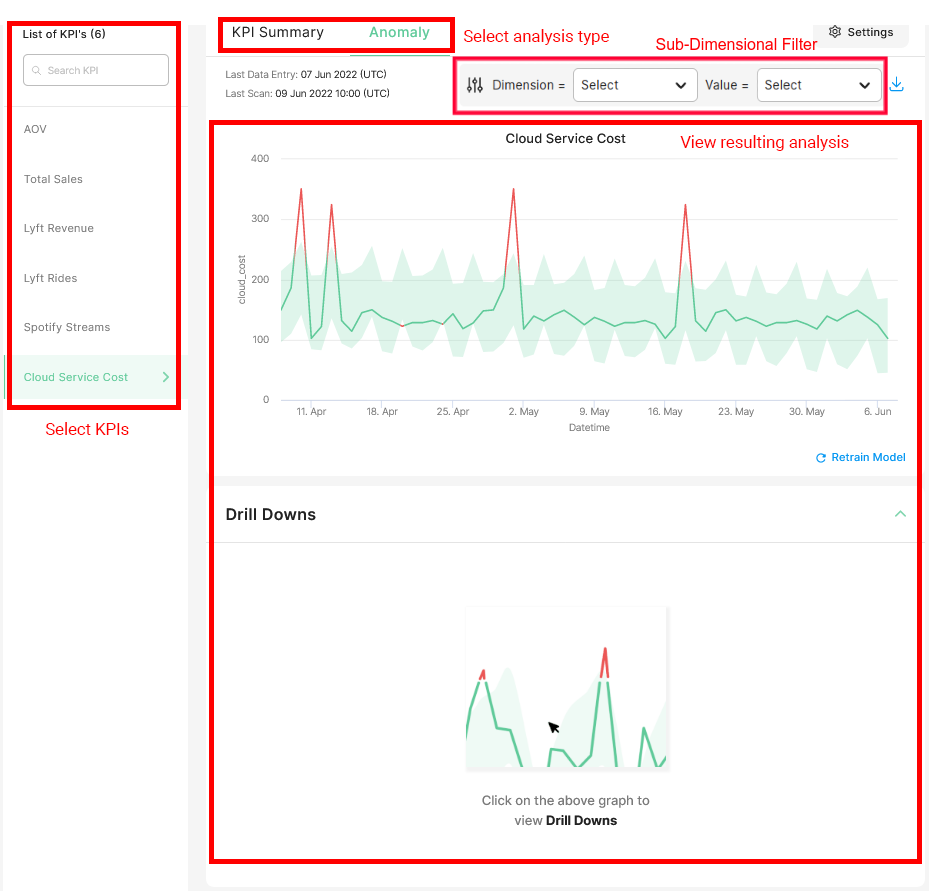
In this example, the selected KPI is "Cloud Service Cost" which was set up as the sum aggregation for the cloud_cost column of our table.
Now let's dive into our Anomaly Detection results!
Overall KPI Anomaly Chart
At the top of your results, a Time Series plot is displayed where each point displays the KPI value for the input time frequency. In this case, a daily frequency is used; this graph shows the sum of cloud_cost each day.
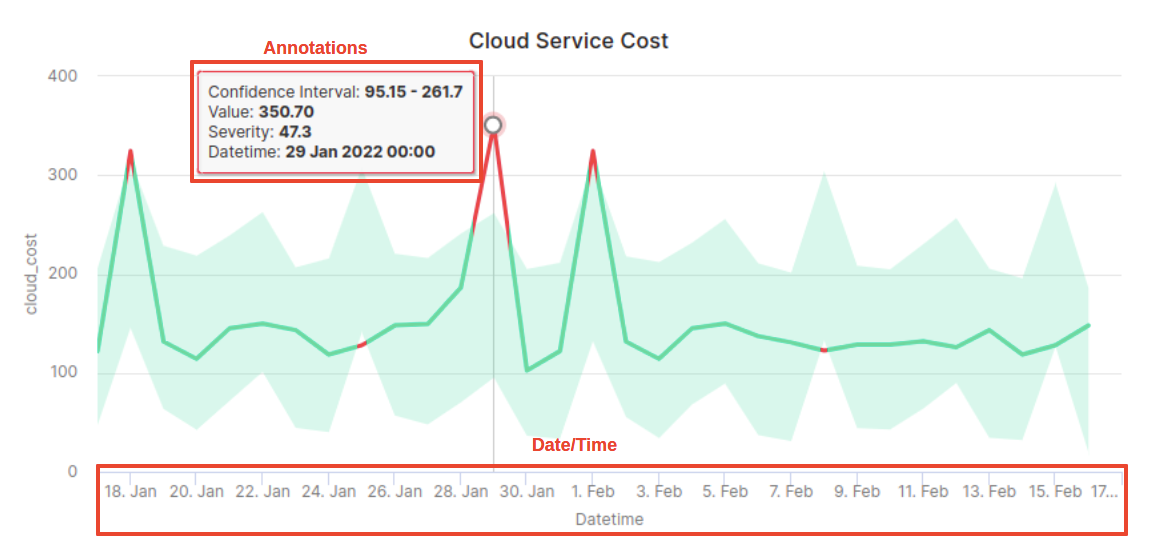
Notice:
The graph is color coded: the time series is green inside our confidence interval, and red outside. Red points are anomalies!
By dragging over any section of the graph, you can zoom into that section.
As you hover over the graph, points are annotated with the KPI value, and Confidence Interval bounds, Severity Score of the Anomaly & the Datetime.
Drill Downs
Having subdimensional drill downs for your anomaly charts can be crucial. Subdimensional drill downs can give you insight into subdimensions that are acting chaotic.
In order to view drill downs for an anomalous point, click on the point in the Overall KPI graph. This will populate the "Drill Downs" expansion tab with Anomaly Graphs for the subdimensions configured with the KPI. If the expansion tab is closed, click on the tab to expand it and view.
The drill downs will look similar to this:
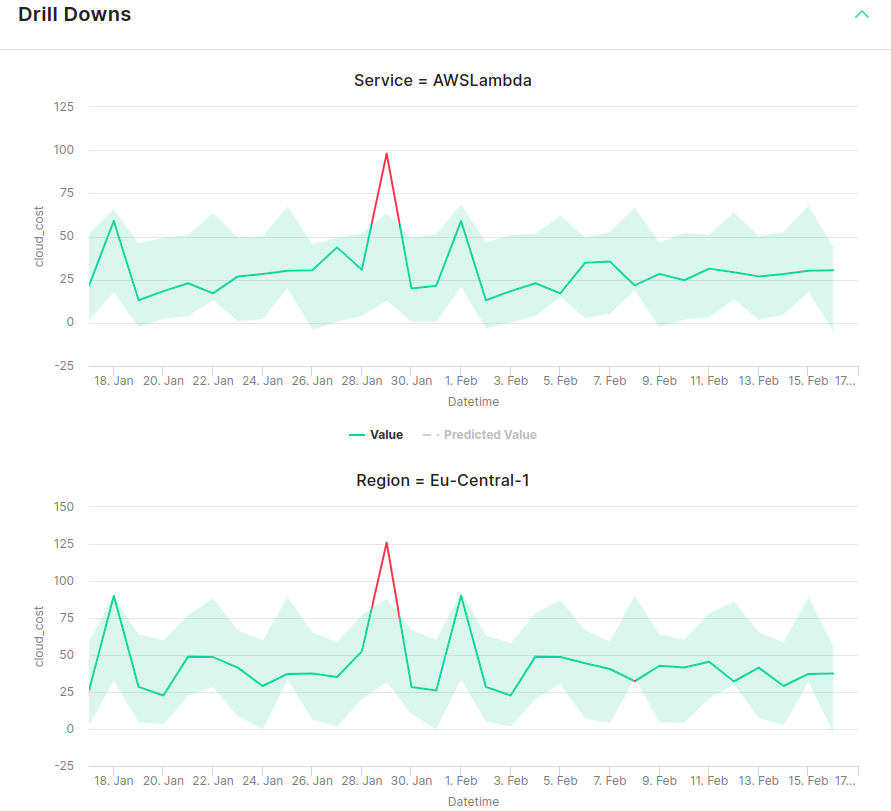
A list of Time series charts are displayed where each graph represents a value for a subdimension. You can scroll down your dashboard and look at each of the Drill Down graphs.
Sub-Dimensional Anomaly Filter
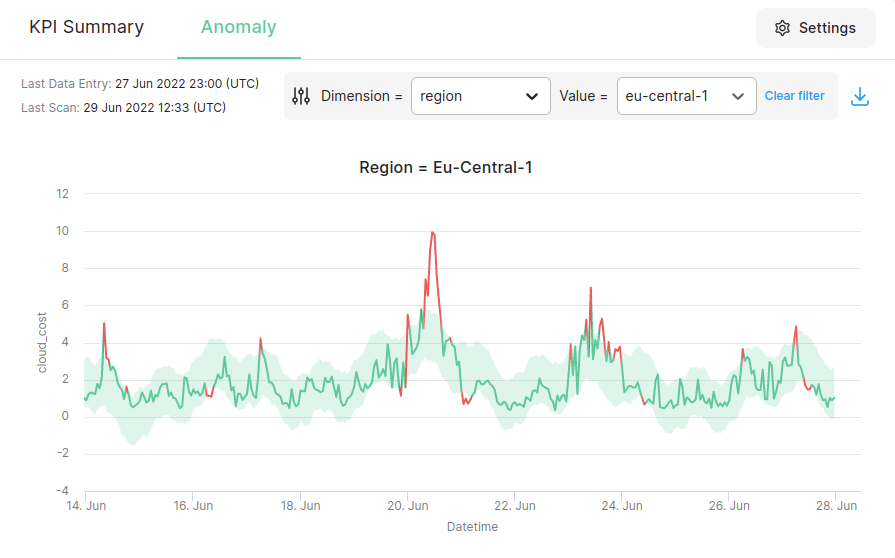
Chaos Genius also provides the added capability of examining anomalies in your dimensions. This will let you know if any of your dimensions suffered any anomalous behaviour over your selected time window.
Users can utilize the filter to select the dimension and it's respective value to view the particular sub-dimension.